


Python set up with Google Colab
Tasks Performed under this project:
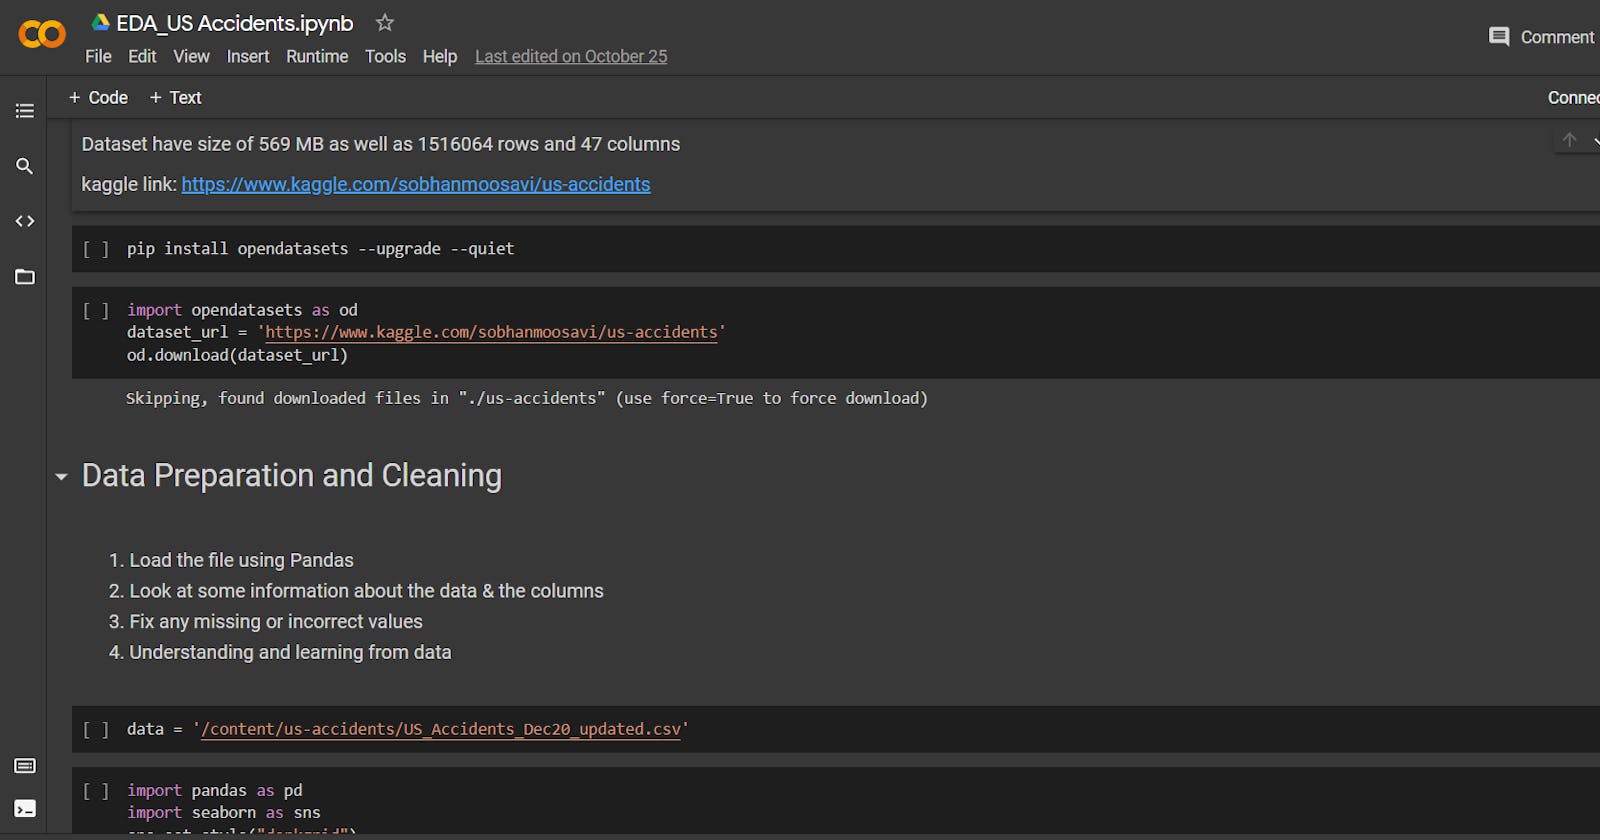
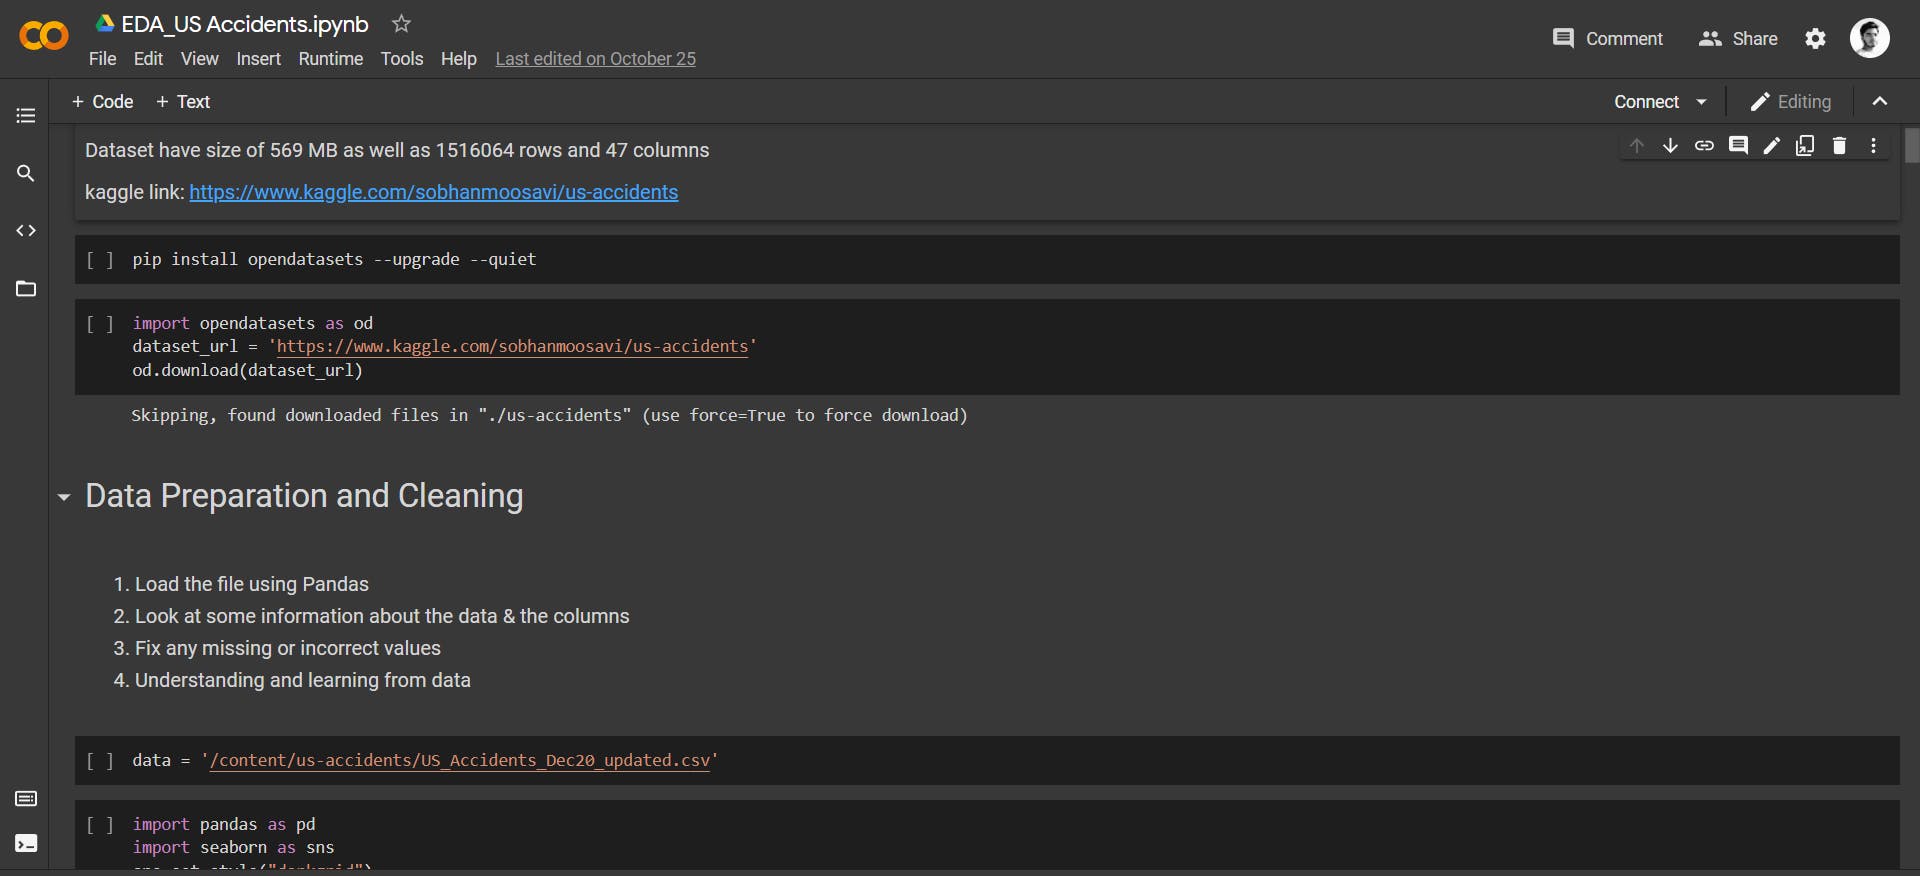
- Importing Dataset
- Data Preparation and Cleaning
- Exploratory Analysis and Visualization
- Answering Relevant Questions
- Summary and Conclusion
About Data
the dataset contains countrywide car accidents records, which cover 49 states of the USA. The accident data are collected from February 2016 to Dec 2020 Currently, there are about 1.5 million accident records in the dataset.
Data Preparation and Cleaning
• Imported accidents data from Kaggle in Google Collab for more than 1.5 million accident records across the US. • Read dataset with pandas and performed Data Exploration & Visualization using python.
Exploratory Analysis, Visualization & Answering Relevant Questions
• Used Pandas for analysis of top cities having most accidents, figured out top 5 cities. • Converted string to timestamp and analyzed the hourly pattern where accidents are more frequent. • Used Seaborn to visualize yearly data and found considerable data is missing for the year 2016.
Summary and Conclusion
• Prepared clear inferences and conclusions and answered relevant questions using Pandas methods and attributes.
Insights:
No data from New York less than 3% of cities have more than 1000 yearly accidents. Over 1100 cities have reported just one accident (need to investigate) data points are missing for the year 2016
Areas of future work:
Accident analysis according to weather Humidity(%) 'Pressure(in) 'Visibility(mi) Accident analysis according to road condition (related columns 'Bump', 'Crossing')
Check out scripts here: